LLM observability is the discipline of capturing model behavior, retrieval context, and runtime signals so engineers can explain why an LLM system did what it did, not just whether it stayed up. If you run inference in production, the immediate step is to emit gen_ai.* spans on every call and turn on sentinel tracing so you catch SLO or quality regressions before users do, with content capture opt-in and masked by default.
TL;DR:
- Latency and cost at the token level can vary significantly, requiring precise telemetry to detect anomalies hidden by average metrics.
- Selective tracing that triggers only on anomalies can reduce overhead by over 97 percent while maintaining effective root-cause diagnosis.
- Observability signals should include detailed traces, latency and token metrics, quality evaluation scores, and full context logs, with careful handling of PII and model versioning.
- Multi-tenant batching complicates attribution, demanding advanced models like roofline-guided attribution to accurately assign delays and costs.
- Fully offline, air-gapped observability is feasible through local storage and standards-based instrumentation, ensuring compliance without external data exfiltration.
Table of Contents
- Why LLM observability matters in production
- LLM-specific challenges to observability
- Core signals and evaluation metrics to collect
- Tracing, attribution, and low-overhead diagnosis techniques
- Instrumentation, standards, and practical toolchain
- Designing a production observability pipeline
- Low-overhead operational patterns and alerting strategy
- How to evaluate and verify your observability in production
- Forge perspective: sovereign observability for air-gapped deployments
- What production teams get wrong about LLM observability
- Forge’s approach to secure local deployments and observability
- Sources
- FAQ
Why LLM observability matters in production
Traditional observability tells you a service is up. LLM observability tells you whether the answer was any good, what it cost, and whether you could defend it in an audit. Those are different questions, and skipping them creates real operational exposure.
Latency SLOs break in ways that classic APM tools miss. A vector database that quietly adds 400 milliseconds to retrieval will not throw an error: it will just make every RAG answer feel sluggish until someone notices churn. Cost is the same story in a different shape. When billing runs per feature or per customer, you need token-level, per-request attribution, not an aggregate monthly invoice, because a single misconfigured prompt template can burn through a budget in one bad afternoon.
The auditability problem is sharper still. When a model gives a wrong or harmful answer, you need the evidence chain: the prompt, the retrieved documents, the model version, the finish reason. Without that, a compliance review or incident postmortem turns into guesswork.
Common failure patterns worth watching for:
- Hallucination incidents that surface in user complaints days after the generating request, with no trace left to inspect
- Prompt templates that balloon token counts silently after a small formatting change
- Vector database latency that hides inside an otherwise healthy p50 but wrecks p99
- Session state leaking across turns in multi-tenant deployments, corrupting cost attribution
Tracing only critical synchronization points, rather than every call, can cut tracing overhead by roughly 97.8% according to StriaTrace’s evaluation, which still preserved root-cause diagnosis across a range of inference abnormalities. That single design choice is why full observability doesn’t have to mean full overhead.
LLM-specific challenges to observability
LLMs break assumptions that most monitoring stacks were built on. A REST endpoint returns the same response for the same input; an LLM call rarely does, even at temperature zero, once retrieval, tool calls, or sampling noise enter the picture.
That non-determinism changes how you test and alert. You cannot assert exact-match outputs in a smoke test, so alerting has to shift toward distributions and evaluation scores rather than fixed expected values.
Agentic and multi-turn workloads add a second layer of difficulty. Sessions are stateful and long-lived, and a failure in turn one might only manifest as a bad answer three turns later, which means causality has to be tracked across calls, not just within one.
- Non-deterministic outputs mean tests and alerts must use score bands and statistical drift, not exact matches
- Multi-turn and agentic sessions require cross-call causality, since a fault can surface calls after it originates
- RAG dependence means retrieval and grounding evidence must be captured alongside the generation, or hallucinations become undebuggable
- Multi-tenant co-batching blurs per-request cost and latency attribution, since several tenants’ requests can share a single batch on the GPU
That last point deserves emphasis: when a serving engine batches requests from different tenants together for GPU efficiency, the “who caused this slowdown” question gets genuinely hard to answer without purpose-built attribution, a problem systems research has only recently started solving directly.
Core signals and evaluation metrics to collect
Observability for LLMs rests on four kinds of telemetry, and each answers a different operational question. Traces answer “what happened in this request.” Metrics answer “how is the system trending.” Evaluation signals answer “was the answer good.” Logs and context answer “what exactly did the model see.”
| Signal type | Examples | What it diagnoses |
|---|---|---|
| Traces | gen_ai.operation.name, provider, model, usage.input_tokens, usage.output_tokens, finish_reasons, conversation.id | Per-request behavior and causality across calls |
| Metrics | Latency histograms (p50/p90/p99), token usage histograms, throughput, error counts, GPU memory | System-level trends and capacity pressure |
| Evaluation signals | Hallucination score, grounding/verifiability, semantic similarity, human-in-the-loop labels | Output quality independent of uptime |
| Logs and context | Model version, prompt (redacted), top-k retrieved evidence, PII masking policy | Forensic reconstruction of a specific answer |
A few things trip teams up early. Token usage histograms matter as much as latency histograms, because a model can be fast and still expensive if prompts creep upward over time. Finish reasons deserve their own field rather than burial in a log blob: a spike in “length” finish reasons often means your context window is undersized before anyone files a bug report.
Evaluation signals are the piece most teams add last and need first. Hallucination scoring and grounding checks turn a vague “the answer felt off” complaint into a measurable drop you can alert on. Combining automatic evals with human-in-the-loop labels catches the cases automatic scorers miss, particularly for domain-specific correctness.
- Capture prompts and retrieved evidence under an opt-in policy with PII masking applied before storage
- Stamp every span with a stable model version string, since silent provider-side model updates are a common source of unexplained quality drift
- Keep raw and masked copies separate so audits can request an unmasked record through a controlled process rather than exposing it by default
Instrumenting to a shared attribute schema like OpenTelemetry’s GenAI semantic conventions makes this telemetry portable across backends, so switching observability vendors later doesn’t mean re-instrumenting every call site.
Tracing, attribution, and low-overhead diagnosis techniques
Full tracing on every LLM call is expensive, and naive sampling throws away exactly the requests you need when something goes wrong. Recent systems research solves this with a more deliberate split between what you always collect and what you collect only when triggered.
LLMVisor tackles the multi-tenant attribution problem directly. When a serving engine batches several tenants’ requests together for efficiency, standard token-count heuristics badly misattribute who caused a slow decode step. LLMVisor instead builds a roofline-guided model: it decomposes batch latency into additive per-request shares using features proportional to FLOPs and memory I/O, calibrated with a short warm-up profiling pass. A prototype integrated into vLLM reports R2 above 0.97 and cuts p90/p99 relative error by up to 3.5 times and 4.4 times respectively on decode, compared with token-count baselines, across multiple models and GPU types.
Roofline-guided models combine interpretable features proportional to FLOPs and memory I/O with short warm-up profiling to obtain microsecond-scale per-request attribution that is accurate across model sizes and GPU types without heavy ML predictors.
That precision matters operationally because it unlocks SLO-aware admission control: you can reject or defer a request before it degrades everyone else’s latency, and you can bill tenants for what they actually consumed rather than an averaged share.
StriaTrace attacks the overhead side of the same problem. Its principle is to trace only critical synchronization points and the critical path by default, then trigger deep tracing automatically when an anomaly appears. That selective approach is what delivers the roughly 97.8% overhead reduction mentioned earlier, and it works because most production requests are healthy and don’t need instrumentation dense enough to explain a failure that isn’t happening.
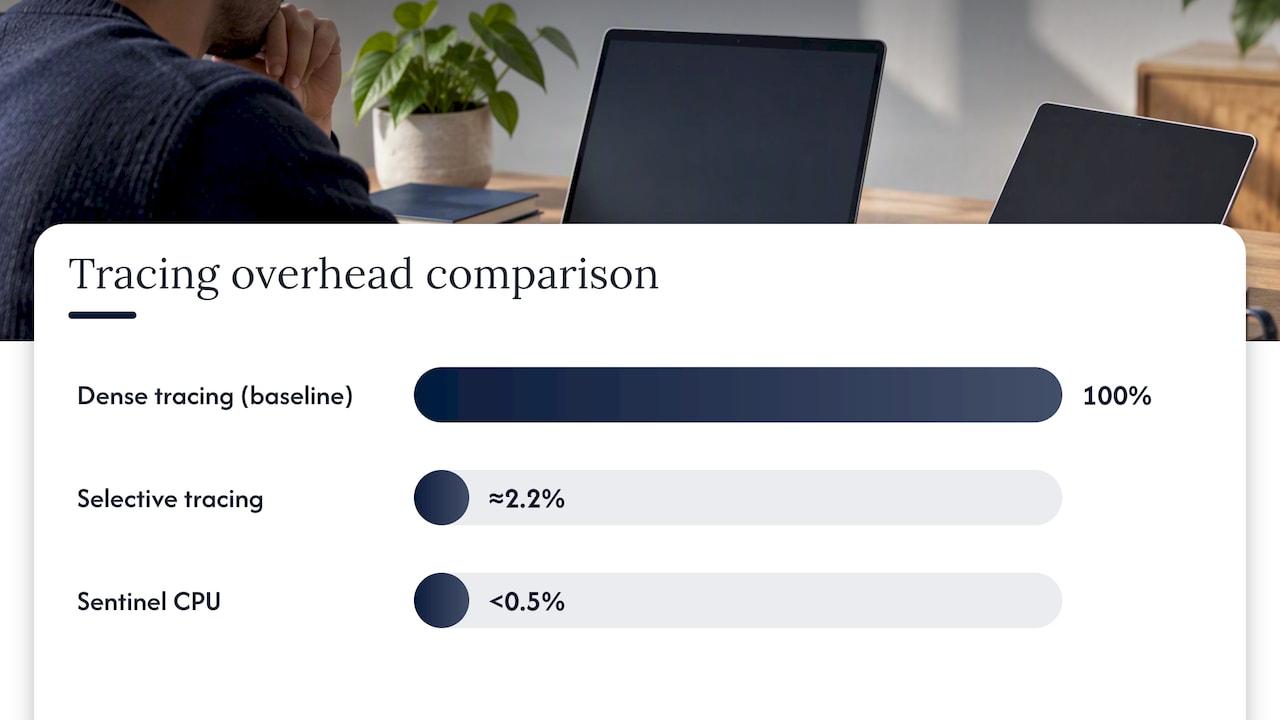
LatencyPrism formalizes this as a two-mode architecture: a sentinel that runs always-on with under 0.5% CPU overhead, paired with a deep-dive tracer that activates only on detected anomalies. In evaluation, this combination achieved an F1 score near 0.985 for anomaly detection in large deployments, using context-aware baselines rather than static thresholds.
The practical takeaways for a production pipeline:
- Run a sentinel-mode collector on every request, capturing only lightweight timing and count metrics
- Trigger deep-dive tracing automatically when the sentinel detects a latency or quality anomaly, not on a fixed sampling rate
- Use per-request attribution, not per-batch averages, when setting admission control or per-tenant cost budgets
- Keep the sentinel path free of prompt content capture entirely, reserving that for the deep-dive path under opt-in rules
LatencyPrism’s sentinel plus deep-dive architecture runs with under 0.5% always-on CPU overhead while still catching anomalies with high precision, according to its evaluation on production-scale LLM inference, which is the clearest evidence yet that comprehensive observability and low overhead aren’t actually in tension if the collection strategy is designed around anomaly triggers instead of blanket sampling.
Instrumentation, standards, and practical toolchain
Instrumentation only pays off long-term if it follows a standard rather than a bespoke schema tied to one vendor’s dashboard. The OpenTelemetry GenAI semantic conventions exist for exactly this reason, defining span names and attributes for LLM calls that any OTLP-compatible backend can consume.
- Emit
gen_ai.operation.name,gen_ai.request.model,gen_ai.usage.input_tokens, andgen_ai.usage.output_tokenson every generation span - Add
gen_ai.response.finish_reasonsso length and content-filter cutoffs are queryable, not buried in raw text - Stamp a stable
gen_ai.conversation.idat span creation using a span processor, so multi-turn sessions group correctly without manual thread-local plumbing - Route spans via OTLP to a real-time store such as ClickHouse or Prometheus for dashboards, and mirror full-fidelity copies to Parquet or object storage for audit retention
- Treat content capture (prompts, completions, retrieved documents) as opt-in, with PII masking applied at the collector before anything touches long-term storage
Pro Tip: Set the conversation id in a span processor at creation time rather than at the call site: it guarantees every span in a session carries it, even ones added later by a library you didn’t write.
The split between real-time and archival storage is not optional at scale. ClickHouse or Prometheus keep dashboards responsive for on-call debugging, while Parquet on object storage keeps years of full-fidelity records at a cost that doesn’t force you into aggressive retention limits.
Designing a production observability pipeline
The pipeline starts with a capture decision: SDK-based instrumentation gives you full fidelity and control over what gets recorded, while a gateway proxy in front of your model calls gives you zero-code coverage at the cost of some visibility into intra-application logic. Most production stacks end up using both, SDK instrumentation for internal services and a proxy for third-party or legacy call sites.
Once captured, data splits into a hot path and a cold path. The hot path, typically ClickHouse or Redis, holds recent traces and metrics for fast interactive debugging during an incident. The cold path, Parquet files on object storage, holds the full-fidelity archive needed for compliance retention and later replay.
- Use SDK instrumentation where you control the code and need full attribute fidelity
- Use a gateway proxy where you need coverage over third-party integrations without touching their code
- Keep 7 to 30 days of hot-path data for interactive queries, with exact windows set by your incident response cadence
- Mirror everything to cold-path storage before hot-path data ages out, so nothing gets lost between tiers
| Deployment context | Storage location | Export path |
|---|---|---|
| Standard cloud deployment | ClickHouse (hot), object storage/Parquet (cold) | OTLP to managed backend |
| Regulated or sensitive workload | On-prem ClickHouse and object storage | OTLP within perimeter, no external egress |
| Air-gapped deployment | Local storage only, no internet-facing endpoints | Local dashboards, controlled export review |
Air-gapped environments change the pipeline in one important way: nothing leaves the perimeter by default. Telemetry storage, dashboards, and alerting all run on infrastructure inside the client’s own network, and any export for external analysis goes through a deliberate, reviewed control rather than an automated pipe.
Low-overhead operational patterns and alerting strategy
Overhead management and alerting design are really the same problem viewed from two angles: you want to know exactly when something is wrong without paying the cost of watching everything all the time.
The dual-mode pattern from LatencyPrism and StriaTrace applies directly here. A sentinel monitor runs constantly at negligible cost, and a deep-dive tracer activates only when the sentinel flags something worth a closer look. Sampling on top of that should be session-aware and weighted toward anomaly propensity, so a session that already looks unusual gets more scrutiny than a routine one, instead of every session getting the same flat sampling rate.
- Run the sentinel on 100% of traffic, tracking only latency, token counts, and error status
- Trigger deep-dive tracing automatically when sentinel metrics cross a context-aware baseline, not a static threshold
- Weight sampling decisions by anomaly propensity within a session rather than applying a uniform rate across all sessions
- Tie alert thresholds to evaluation metrics, such as a grounding score drop or a rising hallucination rate, not just HTTP error codes
- Define a snapshot policy for what gets frozen and retained the moment an anomaly fires: the triggering trace, the prior N turns, and the retrieval context
Pro Tip: An alert that only fires on 5xx errors will miss the most common LLM failure mode: a 200 response with a confidently wrong answer. Wire at least one alert directly to your grounding or hallucination score.
Quality-aware alerting is the piece most teams bolt on last, and it is the one that actually catches the failures users notice first.
How to evaluate and verify your observability in production
An observability system is only useful if it detects the thing it was built to detect, and that has to be tested, not assumed. Define SLOs across both latency percentiles and quality metrics, such as p99 latency under a fixed bound and a grounding score above a set floor, then measure both continuously rather than only at deploy time.
Periodic replay against archived traces is the most direct verification method: feed a known-bad historical trace back through your alerting logic and confirm it still fires. If it doesn’t, your baselines have drifted and need recalibrating before the next real incident exposes the gap.
- Store retrieval fingerprints and evidence references alongside each RAG answer to satisfy forensic or audit requests later
- Run smoke tests against archived anomalous traces at least once per release cycle to confirm detection logic still works
- Track trace coverage as a KPI: the share of production requests with a complete, queryable trace
- Track alert precision and recall against known incidents, plus mean time to root cause, as your core observability health metrics
A sentinel plus deep-dive architecture with under 0.5% always-on overhead achieved an F1 near 0.985 for anomaly detection, per LatencyPrism’s evaluation, which is a useful benchmark for what “good” looks like when you’re setting your own precision and recall targets.
Forge perspective: sovereign observability for air-gapped deployments
Regulated organizations often want everything this guide describes, traces, evaluation signals, full audit trails, without any of that telemetry ever touching a network outside their own walls. Forge builds exactly that kind of deployment: air-gapped, on-prem infrastructure where models, data, and the observability stack watching them all stay inside the client’s own environment.
Entropy-Weighted Quantization technology helps keep models efficient without relying on cloud compute, so performance tuning and monitoring can avoid external dependencies. That matters specifically for observability, because a monitoring stack that phones home defeats the point of an air-gapped deployment before it even starts. A specialized approach shaped by extensive experience in high-security environments treats sovereign observability as an integral part of the deployment rather than an afterthought.
What production teams get wrong about LLM observability
The instinct to trace everything is understandable and mostly wrong. Comprehensive tracing sounds like the safe, thorough choice, but the research covered here, StriaTrace’s roughly 97.8% overhead reduction from selective tracing being the clearest data point, shows that blanket instrumentation is often a worse diagnostic tool than a well-triggered deep-dive, not just a more expensive one. Overhead itself distorts the latency you’re trying to measure.
The bigger blind spot is treating uptime and quality as the same signal. A system that never returns a 500 error can still be quietly wrong on a third of its answers, and most alerting setups are still built entirely around HTTP status codes. If you take one thing from this guide, prioritize wiring an evaluation metric, grounding score or hallucination rate, into your paging system before you invest further in dashboard polish. Traces tell you what happened; only evaluation signals tell you whether it mattered.
— John Ezzell, Founder
Forge’s approach to secure local deployments and observability
Building the observability pipeline described above is one project. Running it inside infrastructure that never sends a prompt, a trace, or a token count outside your own network is another, and it’s the one Forge specializes in.
Certain providers design and deploy sovereign AI systems for organizations in finance, defense, logistics, energy, and manufacturing where data control is critical.
- Secure local and air-gapped deployment that keeps every trace, log, and evaluation score inside the client’s own infrastructure
- Custom model integration and optimization, including techniques for efficient local inference
- Sovereign MLOps and runtime orchestration, plus ongoing performance tuning and operations support
The outcome is auditability and zero data exfiltration by design, not by policy exception. If your team needs an observability stack that never has to ask permission to leave the building, explore Forge’s solutions and start a conversation about your deployment.
Sources
- LLMVisor: A Real-Time Latency Attribution Model for Multi-Tenant LLM Serving
- StriaTrace (OSDI/Usenix materials) — tracing and diagnosis for LLM inference
- Instrument an LLM agent with OpenTelemetry GenAI semantic conventions
FAQ
What is LLM observability?
LLM observability is the practice of capturing traces, metrics, logs, and evaluation signals from language model applications so engineers can explain both system health and answer quality. It goes beyond uptime monitoring by including hallucination and grounding checks, since a healthy-looking system can still produce wrong answers.
How is LLM observability different from traditional observability?
Traditional observability tracks whether a service responds correctly and quickly, using deterministic checks. LLM observability adds non-deterministic output evaluation, retrieval and grounding evidence for RAG systems, and per-request cost attribution across multi-tenant batched inference.
How can I reduce tracing overhead for LLM inference?
Trace only critical synchronization points during normal operation and trigger deep tracing automatically when an anomaly is detected, an approach StriaTrace showed cuts overhead by roughly 97.8% while preserving root-cause diagnosis. A sentinel plus deep-dive pattern, as demonstrated by LatencyPrism, keeps always-on overhead under 0.5%.
What telemetry attributes should I instrument first?
Start with the OpenTelemetry GenAI conventions: gen_ai.operation.name, gen_ai.request.model, gen_ai.usage.input_tokens, gen_ai.usage.output_tokens, and gen_ai.response.finish_reasons. Add a gen_ai.conversation.id at span creation to group multi-turn sessions correctly.
Can LLM observability run in an air-gapped environment?
Yes. Telemetry storage, dashboards, and alerting can all run on infrastructure inside a closed network with no external export path, which is the model Forge builds for regulated, security-sensitive deployments.